Pie Chart: Angular Form
Overview:
| Topic Included: | Formulas, Definitions & Exmaples. |
| Main Topic: | Data Interpretation. |
| Data Interpretation Sub-topic: | Pie Graph Notes & Questions. |
| Questions for practice: | 60 Questions & Answers with Solutions. |
What is a Pie Graph:
A pie graph is a chart or a graphical representation in the form of a circular graph which further divided into small slices that shows the quantity of data. A pie graph could be used for representing financial data, geographical data, or any other data to analyze and calculate the required value.
Types of Pie Graph:
The pie charts can be divided into two types according to the representation of data.
(1). Angular Form Pie-Charts.
(2). Percent Form Pie-Charts.
(1). Angular Form Pie-Charts.
In this type of pie-charts, the data is represented in angular form. Let's understand this with the help of an example given below.
Example: An angular form pie chart is given below. You are required to study the pie chart carefully and answer the questions given.
The number of employees in a company is 1080, represented in angular form.
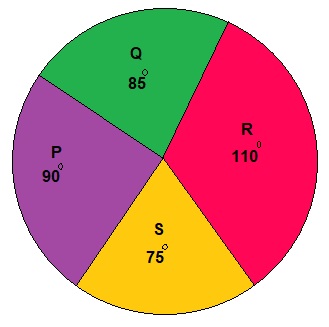
Question (1): Find the employees in section P is how many percent more than that in section S?
Solution: Employees in section P \(= 90^{o}\)employees in section S \(= 75^{o}\)Now the required percentage $$ = \frac{90 - 75}{75} \times 100 $$ $$ = \frac{15}{75} \times 100 $$ $$ = 20 \ \% $$
Question (2): Find the number of employees in section R is how many times more than that in section S?
Solution: Employees in section R \(= 110^{o}\)employees in section S \(= 75^{o}\)Hence, $$ = \frac{110}{75} = 1.46 \ Times $$
Question (3): Find the percent of employees in each section?
Solution: Conversion of angular form to percent form. $$ 360^{o} = 100 \ \% $$ $$ 1^{o} = \frac{100}{360} \ \% $$ Now, the percent of employees in section P, $$ = 90^{o} = \frac{90 \times 100}{360} $$ $$ = \frac{100}{4} = 25 \ \% $$ The percent of employees in section Q, $$ = 85^{o} = \frac{85 \times 100}{360} $$ $$ = \frac{425}{18} = 23.61 \ \% $$ The percent of employees in section R, $$ = 110^{o} = \frac{110 \times 100}{360} $$ $$ = \frac{275}{9} = 30.5 \ \% $$ The percent of employees in section S, $$ = 75^{o} = \frac{75 \times 100}{360} $$ $$ = \frac{375}{18} = 20.83 \ \% $$
Question (4): Find the number of employees in each section?
Solution: Conversion of percent form to angular form. $$ 360^{o} = 1080 \ employees $$ $$ 1^{o} = \frac{1080}{360} $$ $$ = 3 \ employees $$ Now, the number of employees in section P, $$ = 90^{o} = 90 \times 3 $$ $$ = 270 \ employees $$ The number of employees in section Q, $$ = 85^{o} = 85 \times 3 $$ $$ = 255 \ employees $$ The number of employees in section R, $$ = 110^{o} = 110 \times 3 $$ $$ = 330 \ employees $$ The number of employees in section S, $$ = 75^{o} = 75 \times 3 $$ $$ = 225 \ employees $$
Question (5): Find the difference between employees in section R and P is how many times the difference between employees in section Q and S?
Solution: The angular difference between employees in section R and P, $$ = 110 - 90 = 20^{o} $$ The angular difference between employees in section Q and S, $$ = 85 - 75 = 10^{o} $$ the required value, $$ = \frac{20}{10} = 2 \ Times $$
Click here to learn"Percent Form" Pie Chart.