Bar Diagrams: Exercise-6
Overview:
| Questions and Answers Type: | MCQ (Multiple Choice Questions). |
| Main Topic: | Data Interpretation. |
| Data Interpretation Sub-topic: | Bar Graph Questions and Answers. |
| Number of Questions: | 5 Questions with Solutions. |
Directions: Study the following bar diagram carefully and answer the questions given below it.
Import of petroleum (in billion dollars) in different years.
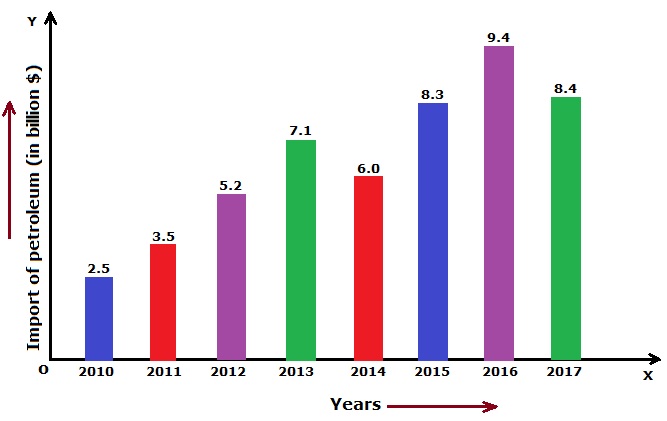
- The average import of petroleum (in billion dollars) for the given period was?
- 5.4 Billion dollars
- 5.9 Billion dollars
- 6.3 Billion dollars
- 6.7 Billion dollars
Answer: (c) 6.3 Billion dollarsSolution: The total value of imported petroleum in the given period =\((2.5 + 3.5 + 5.2 + 7.1 + 6.0 +\\ 8.3 + 9.4 + 8.4)\)\(= 50.4\) Billion dollarsThe average import of petroleum for the given period. $$ = \frac{50.4}{8} $$ $$ = 6.3 \ Billion \ dollars $$
- In which year, there was the maximum percentage increase in the import of petroleum in comparison to the previous year?
- 2011
- 2012
- 2015
- 2017
Answer: (b) 2012Solution: Increase in the import of petroleum (in percent) in different years. $$ 2011 = \left[\frac{3.5 - 2.5}{2.5} \times 100\right] \% $$ $$ = \left[\frac{1.0}{2.5} \times 100\right] \% $$ $$ = 40 \ \% $$ $$ 2012 = \left[\frac{5.2 - 3.5}{3.5} \times 100\right] \% $$ $$ = \left[\frac{1.7}{3.5} \times 100\right] \% $$ $$ = 48.58 \ \% $$ $$ 2013 = \left[\frac{7.1 - 5.2}{5.2} \times 100\right] \% $$ $$ = \left[\frac{1.9}{5.2} \times 100\right] \% $$ $$ = 36.54 \ \% $$ $$ 2015 = \left[\frac{8.3 - 6}{6} \times 100\right] \% $$ $$ = \left[\frac{2.3}{6} \times 100\right] \% $$ $$ = 38.34 \ \% $$ $$ 2016 = \left[\frac{9.4 - 8.3}{8.3} \times 100\right] \% $$ $$ = \left[\frac{1.1}{8.3} \times 100\right] \% $$ $$ = 13.26 \ \% $$ Hence, the maximum increase in import of petroleum was in the year 2012 \((48.58 \ \%)\).
- Find the number of years when the import of petroleum was below average for the given period?
- 3
- 4
- 5
- 2
Answer: (b) 4Solution: As we found the average import of petroleum for the given period was 6.3 Billion dollars, Hence in the years 2010, 2011, 2012, and 2014 the import of petroleum was below average.
- Find in which of the following years, the average import of petroleum was nearly 6 billion dollars?
- 2012 and 2013
- 2011 and 2012
- 2015 and 2016
- 2016 and 2017
Answer: (a) 2012 and 2013Solution: Average import of petroleum in 2012 and 2013. $$ = \frac{5.2 + 7.1}{2} $$ $$ = 6.15 \ Billion \ dollars $$ The average import of petroleum for other pairs of years was much below or higher than 6 billion dollars.
- What was the percentage decrease in the import of petroleum from 2013 to 2014?
- 10.16 %
- 12.29 %
- 14.23 %
- 15.49 %
Answer: (d) 15.49 %Solution: Percentage decrease in import of petroleum from 2013 to 2014. $$ = \frac{6 - 7.1}{7.1} \times 100 $$ $$ = \frac{-1.1}{7.1} \times 100 $$ $$ = -15.49 \ \% $$