Bar Diagrams: Exercise-8
Overview:
| Questions and Answers Type: | MCQ (Multiple Choice Questions). |
| Main Topic: | Data Interpretation. |
| Data Interpretation Sub-topic: | Bar Graph Questions and Answers. |
| Number of Questions: | 5 Questions with Solutions. |
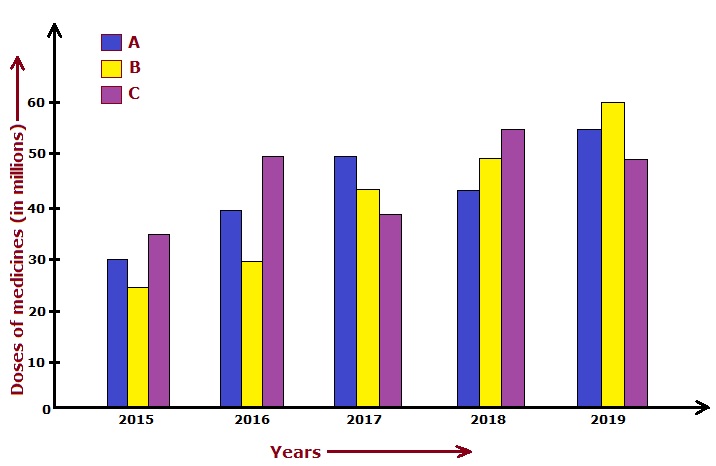
Directions: Study the following bar diagram carefully and answer the questions given below it.
Production of medicine doses (in millions) by companies A, B, and C over the years.
- What is the percentage increase in the production of company B from the year 2015 to 2019?
- 90 %
- 110 %
- 120 %
- 140 %
Answer: (d) 140 %Solution: Percentage increase in the production of company B from the year 2015 to 2019. $$ = \left[\frac{60 - 25}{25} \times 100\right] \ \% $$ $$ = \left[\frac{35}{25} \times 100\right] \ \% $$ $$ = 140 \ \% $$
- Find the company with the maximum average production of medicine over the years?
- A and C
- C
- A
- B
Answer: (b) Company CSolution: Average production of medicines of companies A, B, and C over the years. $$ A = \frac{1}{5} \ (30 + 40 + 50 + 45 + 55) $$ $$ = \frac{1}{5} \times 220 $$ $$ = 44 \ million \ Doses $$ $$ B = \frac{1}{5} \ (25 + 30 + 45 + 50 + 60) $$ $$ = \frac{1}{5} \times 210 $$ $$ = 42 \ million \ Doses $$ $$ C = \frac{1}{5} \ (35 + 50 + 40 + 55 + 50) $$ $$ = \frac{1}{5} \times 230 $$ $$ = 46 \ million \ Doses $$ Hence, the average production of company C was maximum over the years.
- What is the difference between the production of company C in 2018 and company B in 2015?
- 30 Million doses
- 32 Million doses
- 34 Million doses
- 37 Million doses
Answer: (a) 30 Million dosesSolution: Difference between the production of company C in 2018 and company B in 2015. $$ = 55 - 25 $$ $$ = 30 \ Million \ doses $$
- In which year, the percentage rise in the production of medicine from the previous year was the minimum for company B?
- 2016
- 2017
- 2018
- 2019
Answer: (c) 2018Solution: Percentage increase in the production of medicines of company B in comparison to the previous year. $$ 2016 = \left[\frac{30 - 25}{25} \times 100\right] \ \% $$ $$ = 20 \ \% $$ $$ 2017 = \left[\frac{45 - 30}{30} \times 100\right] \ \% $$ $$ = 50 \ \% $$ $$ 2018 = \left[\frac{50 - 45}{45} \times 100\right] \ \% $$ $$ = 11.12 \ \% $$ $$ 2019 = \left[\frac{60 - 50}{50} \times 100\right] \ \% $$ $$ = 20 \ \% $$ Hence the production of company B was minimum in 2018 (11.12 %).
- What is the ratio of the average production of company A during the period 2016-17 to the average production of company B during the same period?
- 3:5
- 2:3
- 6:5
- 5:2
Answer: (c) 6:5Solution: Average production of company A during 2016-17.$$ = \frac{1}{2} \ (40 + 50) $$ $$ = 45 \ million \ doses $$ Average production of company B during 2016-17.$$ = \frac{1}{2} \ (30 + 45) $$ $$ = 37.5 \ million \ doses $$ Required ratio $$ = \frac{45}{37.5} $$ $$ = \frac{6}{5} $$ $$ = 6:5 $$