Pie Chart: Exercise-1
Overview:
| Questions and Answers Type: | MCQ (Multiple Choice Questions). |
| Main Topic: | Data Interpretation. |
| Data Interpretation Sub-topic: | Pie Graph Questions and Answers. |
| Number of Questions: | 5 Questions with Solutions. |
Directions: In the following pie chart, percent of students enrolled in different cultural activeties of a school has been shown. You are require to study the pie chart carefully and answer the questions given below.
Total number of students in the school are 1200.
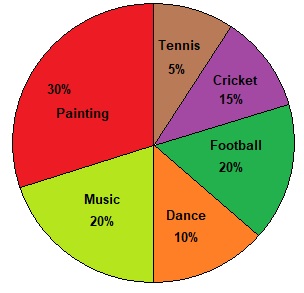
- What the number of students, who opted for cricket?
- 120
- 150
- 160
- 180
Answer: (d) 180Solution: Number of students, who opted for cricket, $$ = \frac{1200 \times 15}{100} $$ $$ = 180 \ Students $$
- What is the respective ratio between the number of students, who opted for football and that who opted for tennis?
- 2:1
- 3:2
- 4:1
- 4:3
Answer: (c) 4:1Solution: Required ratio, $$ = 20 : 5 $$ $$ = 4 : 1 $$
- By what percent is the number of students, who opted for painting more than those who opted for music?
- 35%
- 40%
- 45%
- 50%
Answer: (d) 50%Solution: Required percentage, $$ = \frac{30 - 20}{20} \times 100 $$ $$ = 10 \times 5 $$ $$ = 50 \ % \ Students $$
- How many students have opted for cricket and football together?
- 280
- 340
- 420
- 460
Answer: (c) 420Solution: Number od students, who opted for cricket and football together, $$ = \frac{1200 \times (15 + 20)}{100} $$ $$ = 12 \times 35 $$ $$ = 420 \ Students $$
- What is the respective ratio between the number of students, who opted for music and dancing to those who opted painting?
- 1:1
- 2:1
- 1:2
- 1:3
Answer: (a) 1:1Solution: Required ratio, $$ = (20 + 10) : 30 $$ $$ = 30 : 30 = 1 : 1 $$