Pie Chart: Percent Form
Overview:
| Topic Included: | Formulas, Definitions & Exmaples. |
| Main Topic: | Data Interpretation. |
| Data Interpretation Sub-topic: | Pie Graph Notes & Questions. |
| Questions for practice: | 60 Questions & Answers with Solutions. |
(2). Percent Form Pie-Charts:
In this type of pie-charts, the data is represented in percent form. Let's understand this with the help of an example given below.
Example: A percent type pie chart is given below. You are required to study the pie chart carefully and answer the questions given.
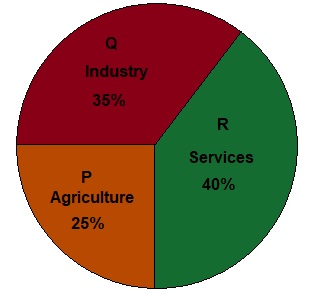
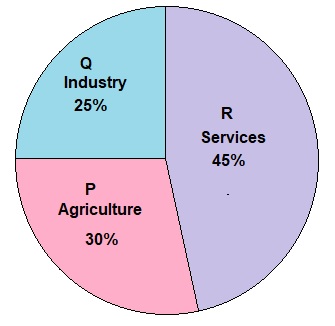
The GDP of a state in financial years 2010 and 2018 is represented according to different sectors by a pie-chart given below.
The value of GDP in 2010 is $500 billion.
The value of GDP in 2018 is $1000 billion.
Question (1): Find the GDP value of different sectors in the financial year 2010?
Solution: The GDP value of the Agriculture sector in the financial year 2010, $$ = 25 \ \% = \frac{25 \times 500}{100} $$ $$ = $125 \ billion $$ The GDP value of the Industry sector in the financial year 2010, $$ = 35 \ \% = \frac{35 \times 500}{100} $$ $$ = $175 \ billion $$ The GDP value of the Service sector in the financial year 2010, $$ = 40 \ \% = \frac{40 \times 500}{100} $$ $$ = $200 \ billion $$
Question (2): Find the GDP value of different sectors in the financial year 2018?
Solution: The GDP value of the Agriculture sector in the financial year 2018, $$ = 30 \ \% = \frac{30 \times 1000}{100} $$ $$ = $300 \ billion $$ The GDP value of the Industry sector in the financial year 2018, $$ = 25 \ \% = \frac{25 \times 1000}{100} $$ $$ = $250 \ billion $$ The GDP value of the Service sector in the financial year 2018, $$ = 45 \ \% = \frac{45 \times 1000}{100} $$ $$ = $450 \ billion $$
Question (3): Find the growth rate of the GDP in each sector for the duration 2010 to 2018?
Solution: The value of GDP in each sector has taken from the questions (1) and (2).The growth rate in the Agriculture sector from $125 billion in 2010 to $300 billion in 2018, $$ = \frac{300 - 125}{125} \times 100 $$ $$ = 140 \ \% $$ The growth rate in the Industry sector from $175 billion in 2010 to $250 billion in 2018, $$ = \frac{250 - 175}{175} \times 100 $$ $$ = 71.4 \ \% $$ The growth rate in the Service sector from $200 billion in 2010 to $450 billion in 2018, $$ = \frac{450 - 200}{200} \times 100 $$ $$ = 125 \ \% $$
Question (4): Find the overall growth rate for the duration 2010 to 2018?
Solution: The overall growth rate in the GDP from $500 billion in 2010 to $1000 billion in 2018, $$ = \frac{1000 - 500}{500} \times 100 $$ $$ = 100 \ \% $$
Question (5): Find the average annual growth rate for the duration 2010 to 2018?
Solution: The average annual growth rate, $$ = \frac{1000 - 500}{500} \times \frac{100}{8} $$ $$ = 12.5 \ \% $$