Pie Chart: Exercise-5
Overview:
| Questions and Answers Type: | MCQ (Multiple Choice Questions). |
| Main Topic: | Data Interpretation. |
| Data Interpretation Sub-topic: | Pie Graph Questions and Answers. |
| Number of Questions: | 5 Questions with Solutions. |
Directions: A pie-chart given below shows the expenditure of a family in percentage during the year 2016. Study the graph and answer the questions given below.
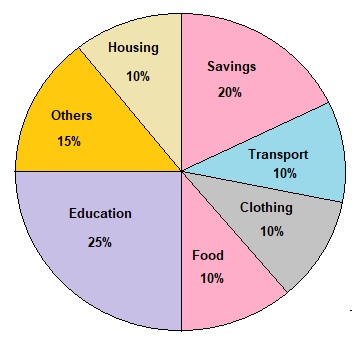
- If the total amount spent during the year 2016 was Rs.150,000, then find the amount spent on the education?
- Rs.35,000
- Rs.30,000
- Rs.37,500
- Rs.32,500
Answer: (c) Rs.37,500Solution: 25% of the total amount spent on the education, Hence $$ = \frac{150,000 \times 25}{100} $$ $$ = Rs.37,500 $$
- If the total amount spent during the year 2016 was Rs.150,000, then find the amount spent on transport and housing together?
- Rs.25,000
- Rs.30,000
- Rs.32,000
- Rs.35,000
Answer: (b) Rs.30,000Solution: The family spent total 20% on transport and housing together, Hence $$ = \frac{150,000 \times 20}{100} $$ $$ = Rs.30,000 $$
- According to the graph, maximum amount spent on
- Education
- Savings
- Others
- Housing
Answer: (a) EducationSolution: The family spent 25% on education, which is the highest.
- Find the ratio of the total amount of money spent on 'others' to that spent on 'education'?
- 1:2
- 2:3
- 3:5
- 5:7
Answer: (c) 3:5Solution: The family spent 15% on 'others' and 25% on 'education', Hence required the ratio, $$ = 15 : 25 $$ $$ = 3 : 5 $$
- If the total amount spent during the year 2016 was Rs.150,000, then find the amount the family saved?
- Rs.15,000
- Rs.20,000
- Rs.25,000
- Rs.30,000
Answer: (d) Rs.30,000Solution: According to the graph the family saved 20% of the total amount, Hence $$ = \frac{150,000 \times 20}{100} $$ $$ = Rs.30,000 $$